Profiling the Emulated Firmware Loop Before Board Bring-Up
Power management begins as a behavior problem before it becomes a battery-life number. The StackCalc firmware has to decide when to scan the matrix, wake the display path, skip an unchanged frame, save state, and return to a lower-work loop. We can exercise those decisions in the RP2350 emulator while the PCB is in fabrication.
Counters make the loop inspectable
The simulator exposes firmware profiling symbols for boot completion, total loop count, active and sleep-loop counts, full and wake-only matrix scans, render count, display transfers, skipped display updates, average loop work, and the maximum loop-work interval. The Node service resolves those symbols from the generated firmware ELF and reads them from emulator memory alongside the 1,188-byte framebuffer.
That gives us a concrete experiment: run a named interaction sequence, inspect which wake and render paths changed, then adjust code or thresholds and repeat the same sequence. An unchanged display should not cause the same work as a changed result. A keypress should wake the work needed for a responsive next frame without leaving the loop needlessly busy afterward.
What an emulator profile can say
It can compare control-flow choices in the compiled firmware image: whether a sequence reached the intended sleep branch, whether a matrix scan occurred, and whether an update produced a new display frame. It is also useful for finding accidental work introduced by a code change.
It cannot measure board current, regulator behavior, display inrush, battery voltage sag, or real button-to-photon latency. Those require the fabricated board, selected display, battery hardware, and an instrumented measurement setup. We publish simulator results as tuning evidence, then follow them with physical measurements rather than treating the model as a battery claim.
Profile a sequence, not an adjective
“Low power” is not a useful firmware decision until it names the behavior being observed. The emulator exposes counters for boot completion, total and active loop work, sleep loops, full and wake-only matrix scans, renders, display transfers, skipped identical frames, and maximum loop interval. That turns a key sequence into something we can compare from one firmware revision to the next.
A minimal reporting loop looks like this:
An unchanged screen should produce a different counter pattern from a changed result. A keypress should wake the required matrix, calculation, render, and transfer work, then let the loop return to its low-work behavior. If a code change turns an idle sequence into repeated display transfers, the counters make the regression visible before it becomes a measurement session on the board.
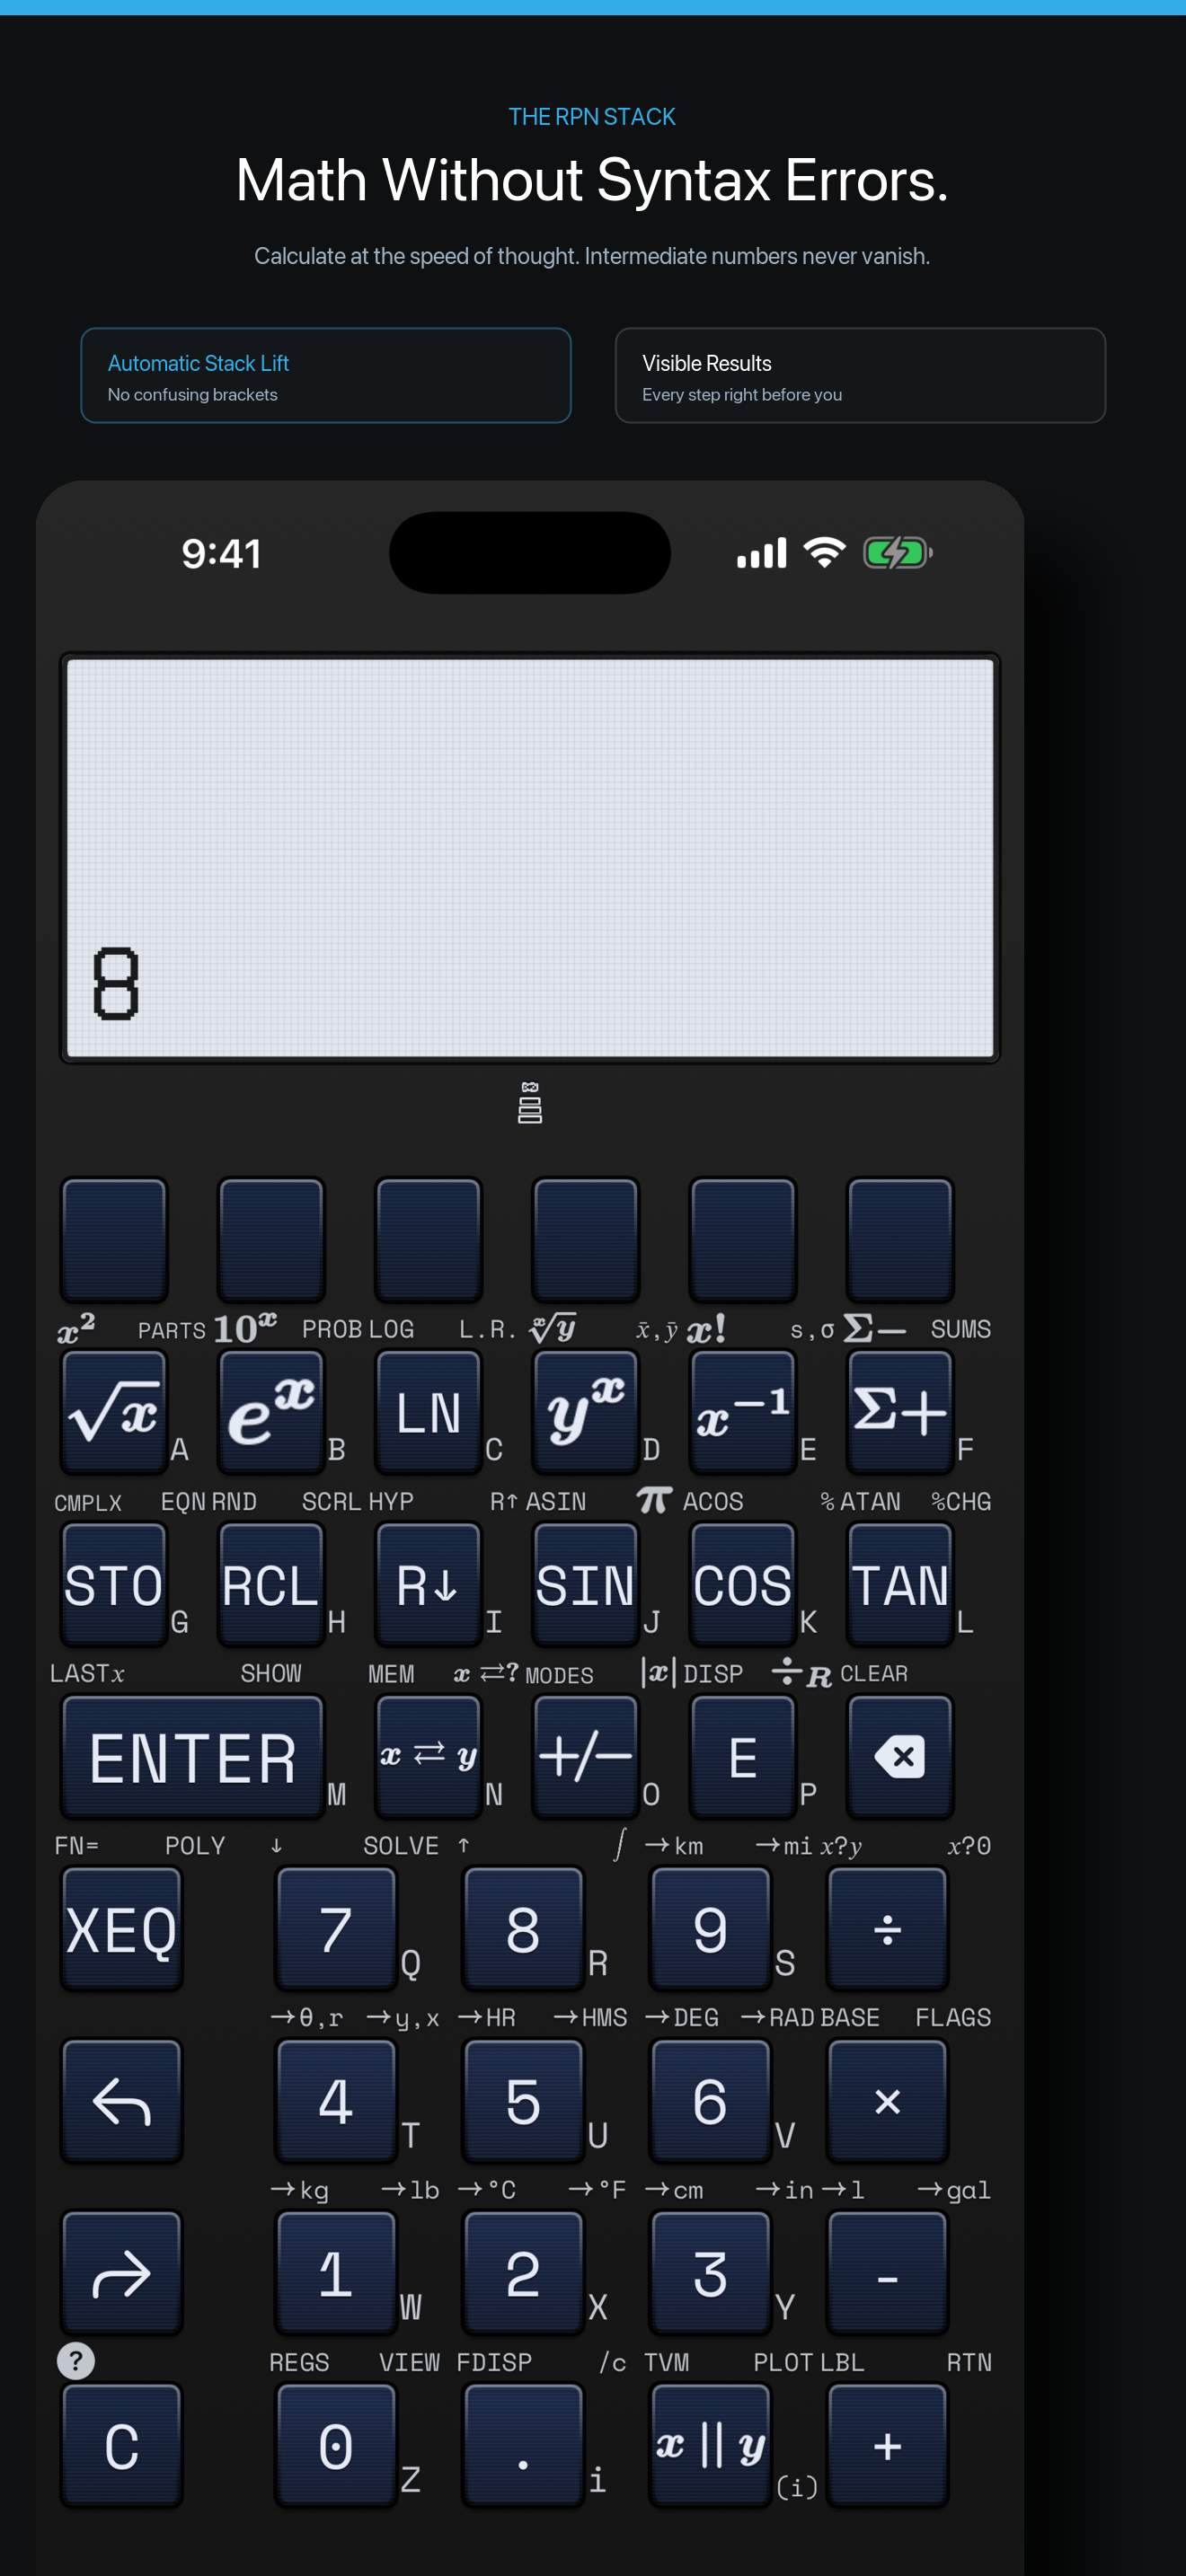
The fabricated board will add the electrical measurement layer: current draw, regulator behavior, display inrush, and real input-to-photon timing. The emulator gives us the named sequences and software baseline to carry into that test. The related firmware simulator article explains the matrix and framebuffer path.
Keep the experiment repeatable
Each profile should name the firmware revision, reset state, interaction sequence, and counter deltas. That prevents an idle-loop comparison from being confused with a warmed-up display path or a different saved-state condition. The first board session can replay those named sequences with a current probe and display timing capture. When a measured result differs from the emulator’s work counters, the discrepancy becomes a concrete hardware question—display bus activity, regulator losses, or wake timing—rather than a vague disagreement about whether the firmware was efficient.